
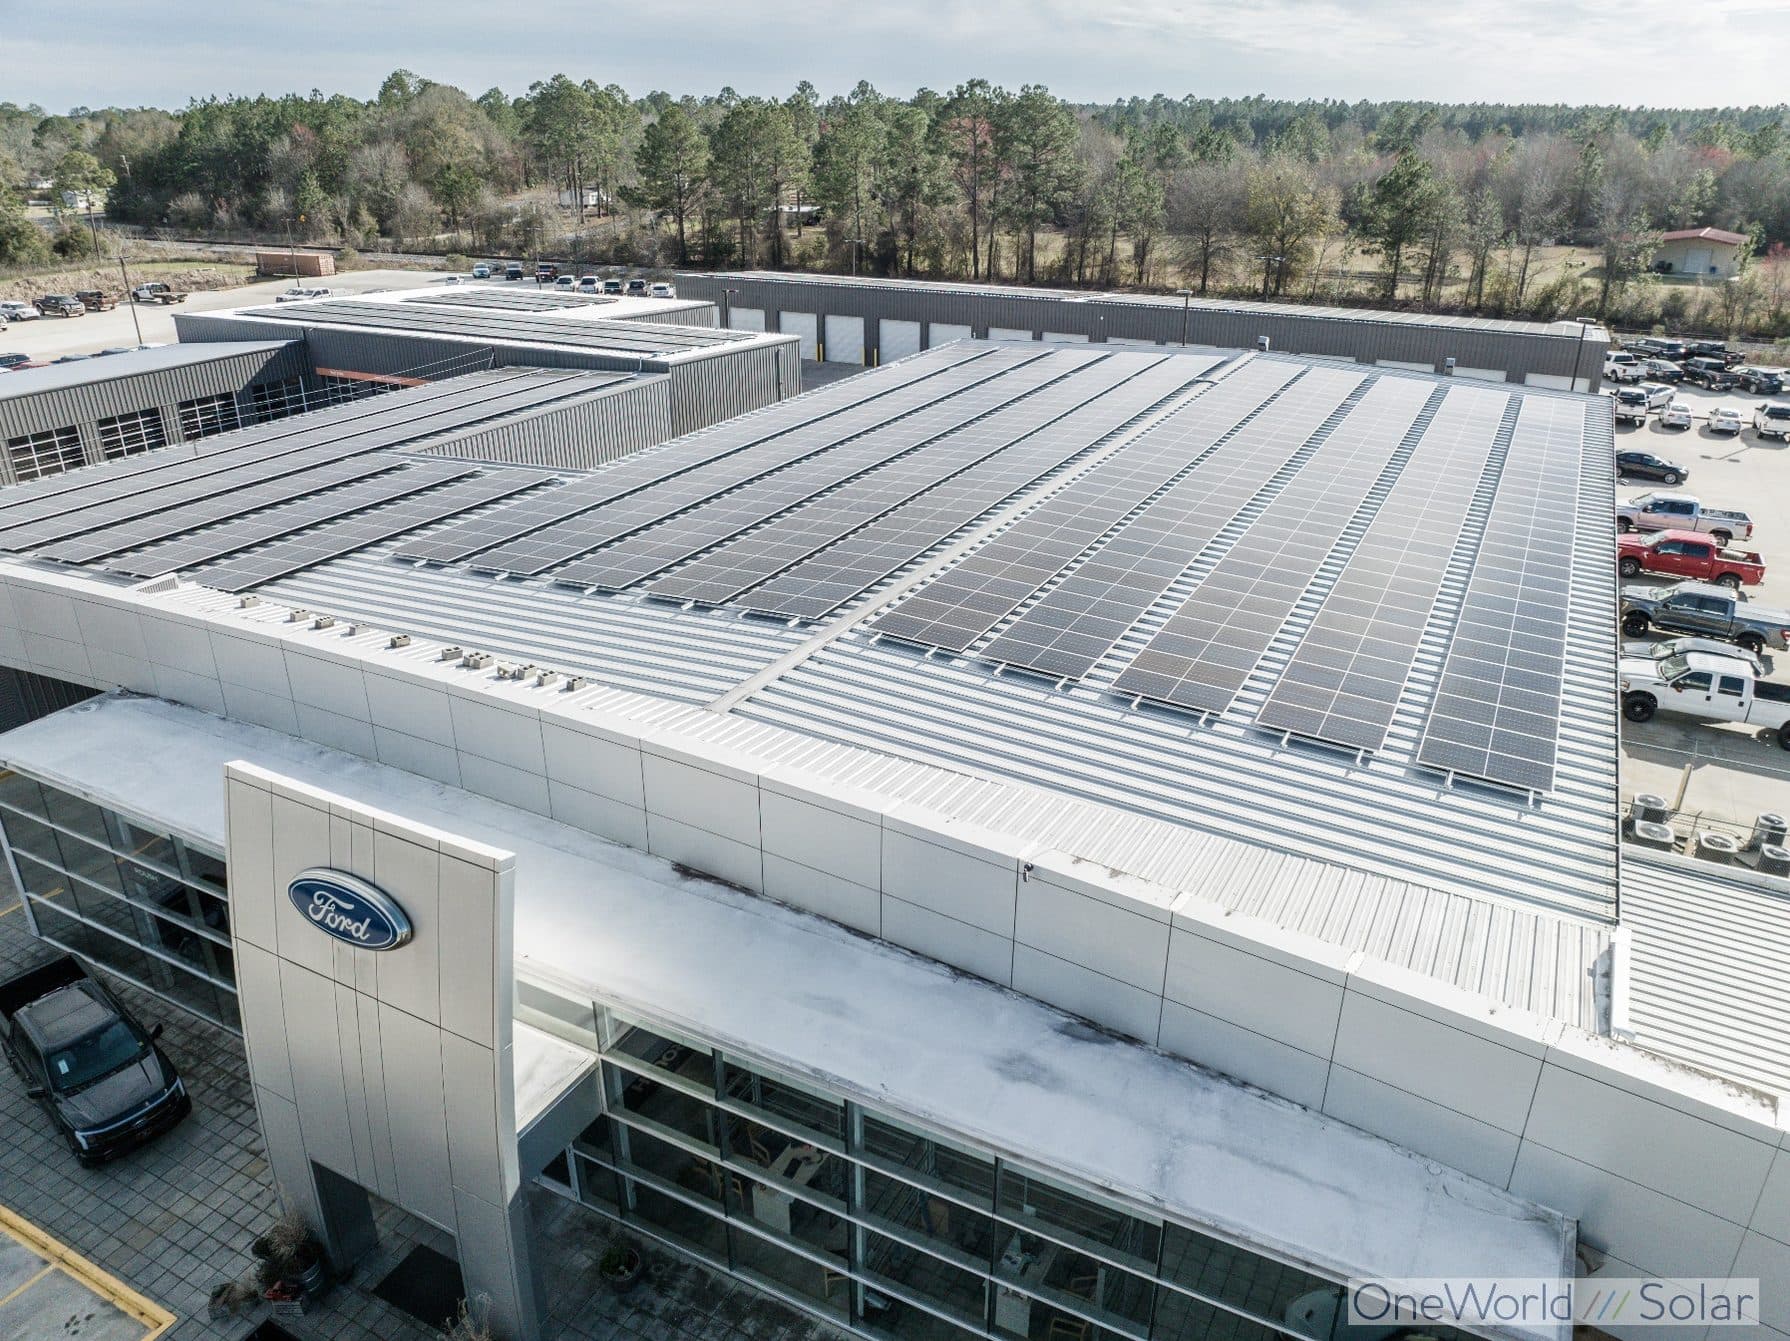
Car dealerships are one of the better commercial solar candidates in the Southeast, and the reason is boring: the building draws hardest exactly when the sun is up. The solar payback period for car dealerships benefits from that alignment more than most property types, because energy consumed on site is worth your full retail rate rather than whatever your utility pays for exported power.
That said, a dealership is not one load. It is a showroom, a service department, a body shop, a wash bay and a lit lot, and those four or five things behave very differently. Some of them solar addresses well. One of them, the lot lighting that burns from dusk to close, solar does not address directly at all. Being clear about which is which is the difference between a proposal that holds up and one that disappoints in year two.
OneWorld Solar has built more than 1 MW across the Woody Folsom Automotive Group's Chevrolet, Ford and Chrysler Dodge dealerships, so what follows is written from that work rather than from a generic commercial template. All figures further down are illustrative and marked as such.
What does a dealership's load profile actually look like?
Break the building into its parts and the pattern is obvious.
- Showroom HVAC. A glass box in a Georgia summer is an air conditioning problem before it is anything else. Solar gain through the display glass drives cooling load that peaks in the middle of the afternoon, which is also when a solar array is producing hardest.
- Lighting. Showroom, offices, parts counter and service drive lighting runs the full business day, every day the doors are open.
- Service bays. Compressors, lifts, tire machines, alignment racks and diagnostic equipment. Intermittent, but heavily clustered in business hours, and the compressor is a spiky load.
- Body shop. Where there is one, paint booth fans, curing and extraction are meaningful loads with their own duty cycle.
- Wash bay. Pumps, blowers and heating, running through the day and often heaviest before a weekend.
- Lot lighting. Runs after dark, often until late, sometimes all night for security. Solar does nothing for this in real time.
Add those together and you get a consumption curve that rises through the morning, peaks in the afternoon and drops in the evening except for the lighting tail. That is close to the shape of a solar production curve, and it is why dealerships beat the average.
How much roof do you actually have, and is it enough?
This is where enthusiasm meets a tape measure. A dealership footprint is usually a lot of building, but not all of it is usable.
The showroom roof is frequently interrupted by mechanical units, skylights and architectural features tied to the brand's facility standards. The service and parts building is normally the better host: larger unbroken planes, simpler structure, and out of the sightline from the road. On sites where the two buildings are separately metered, which array feeds which meter becomes a design decision with real financial consequences.
The practical question is not "how many panels fit" but "how many kilowatt-hours do you use, and what share of them can this roof cover." A roof that supplies a meaningful share of daytime consumption while staying within your interconnection limit is a better outcome than the largest array the structure will hold. We assess the roof, its remaining life and the attachment method during the feasibility study, because putting a long-life array on a roof that is near the end of its own service life is a decision to pay to remove and reinstall it later.
Are solar canopies over inventory worth the extra cost?
Sometimes the roof is not the answer. Dealerships sit on a great deal of paved, sun-exposed land that is already yours, already cleared, and already serving a purpose.
A canopy over inventory or customer parking generates power and does two other things at once: it shades vehicles from heat and it puts a structure between your inventory and hail. For a lot carrying a large number of new units, that protection has a value that has nothing to do with kilowatt-hours, and it belongs in the business case.
The honest trade-off is cost. Canopies require structural steel and foundations, so they cost more per installed watt than a rooftop array on an existing building. If you judge a canopy purely on energy payback against a rooftop alternative, the rooftop wins. If you judge it on energy plus hail and heat protection plus a covered customer experience, the answer often flips.
What does EV charging do to the numbers?
This is the part that changes fastest, and it is where the most expensive mistakes are being made right now.
Level 2 charging on the service drive is a manageable load. DC fast charging is not the same animal. It draws very high power for short periods, and a single charging event can establish a new billed peak demand for the month. Adding panels does not fix that, because the charging event may happen when the array is not producing, and because your utility may set your peak demand at times when solar is not effective, including cloudy days and after dark. Solar reduces your total consumption; it cannot be expected to mitigate your peak demand.
The tool that addresses a demand spike is commercial battery storage, which discharges into the peak so the meter never sees it. If your franchise agreement is pushing you toward fast charging, model the charging load and the demand charge before you size the array, not after. The right project may be a smaller array plus storage rather than a larger array alone.
How do brand standards constrain what goes on the roof?
Manufacturer facility image programs govern elevations, materials, signage sightlines and, in some cases, roof work and approvals. A group carrying several franchises may be working within several sets of standards simultaneously.
Solar is rarely prohibited, but visibility from the front elevation, module placement relative to signage, and who signs off are all live questions. They are far cheaper to resolve during design than during permitting. We work them into the layout at the start.
An illustrative payback walkthrough
The table below is an illustration only, built from round numbers to show how the pieces fit together. It is not a quote and it is not a projection of your result. Every figure needs verification against current pricing, your own rate schedule and current tax law.
| Line | Illustrative figure |
|---|---|
| System size | 250 kW |
| Installed cost | $500,000 |
| Federal investment tax credit at 30% | $150,000 |
| Illustrative value of depreciation deductions | $89,250 |
| Illustrative net cost after credit and depreciation | $260,750 |
| Estimated annual utility saving | $45,000 |
| Resulting simple payback range | 5 to 8 years |
Where that range moves
Four variables move it more than anything else: your effective blended rate per kWh, the share of production consumed on site rather than exported, whether your tariff carries a demand charge, and whether your business has the federal tax liability to actually use the credit and the deductions. That last one is your Certified Tax Accountant's call, not ours, and the credit is claimed on your return rather than granted by us.
You can generate a first-pass size, saving and payback range from your monthly bill with the commercial solar savings calculator. For the tax mechanics, see Section 179 solar depreciation and the 30% commercial solar tax credit.
What did the multi-rooftop approach at Woody Folsom look like?
Woody Folsom Automotive runs multiple franchises across multiple sites, and treating them as one portfolio rather than three unrelated buildings changed the project. Engineering, procurement and crew mobilization were shared, the metering and interconnection questions were worked through as a set, and the group ended up with more than 1 MW installed across the Chevrolet, Ford and Chrysler Dodge stores.
If you operate more than one rooftop, that is worth considering before you pilot solar on a single store. The detail is in the Woody Folsom Automotive 1 MW solar case study, with more on the sector at solar for car dealerships and on the state's rate and interconnection landscape at commercial solar installation in Georgia.
Send us twelve months of bills for each store. The load profile does most of the talking.